
Excel & Spreadsheets Mastery
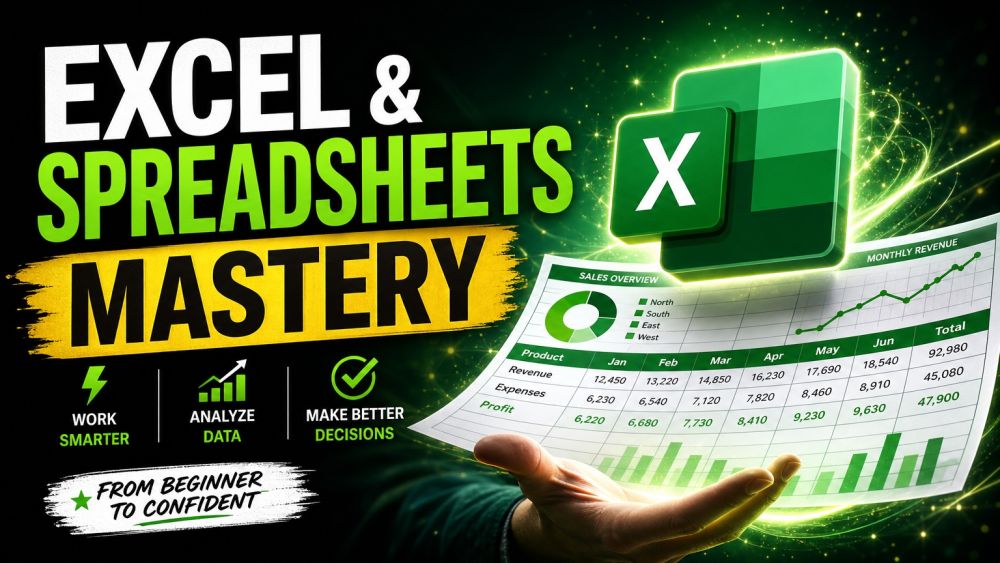
BeginnerSpreadsheets run the working world, and the people who are comfortable in them look like magicians to everyone else. This beginner course makes you one of them — no finance degree, no jargon, just the practical skills that save you hours every week. You will start with the grid itself: cells, rows, references, and how to write your first formulas without fear. From there you build real fluency with the functions that do the heavy lifting — SUM, AVERAGE, IF, COUNTIF, VLOOKUP and XLOOKUP — and learn when to reach for each one. Then you tame messy data: sorting, filtering, cleaning, removing duplicates, and using tables so your work stays organized as it grows. You will turn raw numbers into clear charts that tell a story in one glance, and finish with light analysis — PivotTables, summaries, and dashboards that answer real questions. Every lesson uses realistic examples you can copy straight into your own sheets. By the end you will open a blank spreadsheet with confidence and be the person on your team who just figures it out.
Videos
See allTracks
Everything in a spreadsheet starts with the grid, so this is where you build a fearless foundation. You will learn how cells, rows, and columns work, how to write a formula that starts with the equals sign, and the single most important idea in Excel: cell references. You will master relative versus absolute references (the dollar-sign trick), how to copy formulas without breaking them, and the order of operations. By the end you will read and write basic formulas with confidence and never be intimidated by a blank sheet again.
Functions are the power tools of Excel, and a handful of them cover most real work. This track teaches you the essentials one at a time with clear examples: SUM and AVERAGE for totals, IF for decisions, COUNTIF and SUMIF for conditional counting and adding, and the lookup functions VLOOKUP and XLOOKUP for pulling data from other tables. You will learn what each one expects, how to avoid common errors, and how to combine them. By the end you will reach for the right function automatically instead of doing things by hand.
Real spreadsheets get messy fast, so this track makes you the person who brings order to chaos. You will learn to sort and filter to find what matters, clean data by trimming spaces and fixing text, remove duplicates safely, and split or combine columns. Most importantly you will use Excel Tables, which keep formatting and formulas consistent as your data grows. By the end you will take a raw, ugly export and turn it into a clean, reliable dataset you can actually work with.
A good chart says in one glance what a table hides in a hundred cells. This track teaches you to choose the right chart for the message — columns for comparison, lines for trends over time, pie only when parts of a whole truly matter — and to build them in a few clicks. You will learn to label clearly, remove clutter, highlight the key point, and avoid the misleading tricks that ruin trust. By the end you will turn raw numbers into clean, honest visuals that make your reports instantly understandable.
This is where everything comes together and Excel starts answering real business questions. You will learn PivotTables — the fastest way to summarize thousands of rows into a clear table — how to slice data by category, add totals and percentages, and spot patterns. Then you will assemble simple dashboards that combine summaries and charts so a busy reader gets the answer in seconds. You will also meet handy tools like conditional formatting to make numbers speak. By the end you will turn a big pile of data into a clear, decision-ready report.
Certification Exam
Certification Exam
Excel & Spreadsheets Mastery
All tracks · No time pressure to start
Certification Exam
Excel & Spreadsheets Mastery
30 Questions
All difficulty levels
45 Minutes
Auto-submits when time expires
70% to Pass
Earn your certification badge
No Going Back
Once you answer, you move forward
Tips
See allTest scenarios with Goal Seek
Work backward from the answer you want
Filter visually with slicers
Give your report clickable buttons
Refresh your PivotTable
It does not update on its own
Summarize anything with a PivotTable
Drag and drop your way to answers