
WBF Academy
SQL for Data Analytics

SQL for Data Analytics

Beginner

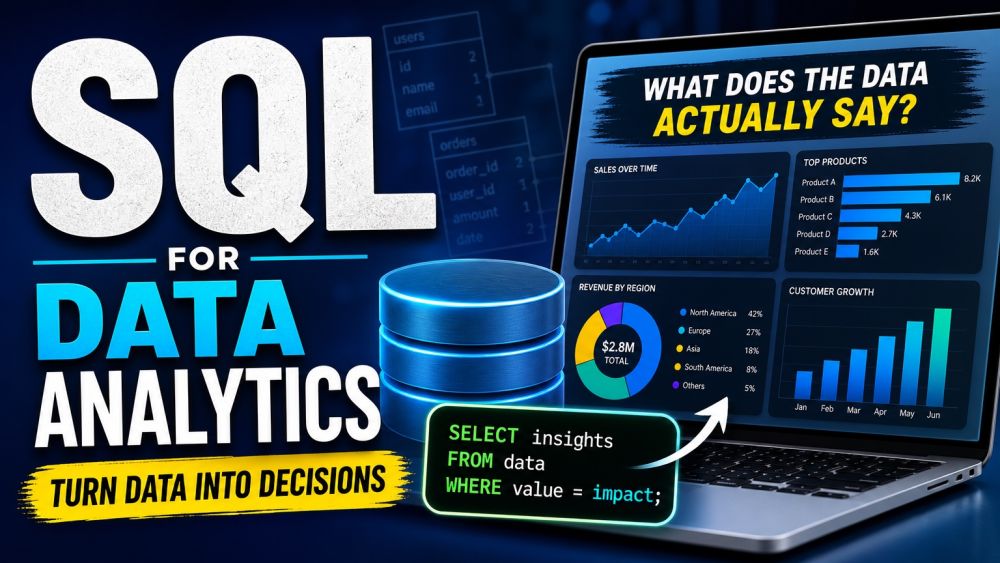
Every product decision, marketing report, and business dashboard starts with the same question: what does the data actually say? This beginner course teaches you SQL — the language every analyst, product manager, and engineer uses to ask that question and get a real answer. You will start from zero, writing your first SELECT statement and pulling exact columns from a table, then build up to filtering rows with WHERE, sorting results, and handling missing values. From there you move into the heart of analytics: grouping data with GROUP BY, counting and summing with aggregate functions, and finding patterns that a single row never shows. You will learn to combine tables with JOINs so you can connect customers to orders, or employees to departments, instead of working with data trapped in separate silos. By the end, you will write subqueries, common table expressions, and window functions — the same tools used for running totals, rankings, and month-over-month comparisons in real dashboards. Every lesson uses realistic business tables (customers, orders, products, employees) so what you practice maps directly onto real analyst work. No prior coding background is required — just curiosity about what the numbers mean. By the end of this course you will read, write, and reason in SQL confidently enough to answer real business questions with real data, not guesses.

📋 5 tracks ❓ 250 questions 💡 20 tips 🎬 10 videos ⏱ ~5h

Videos

See all

Tracks

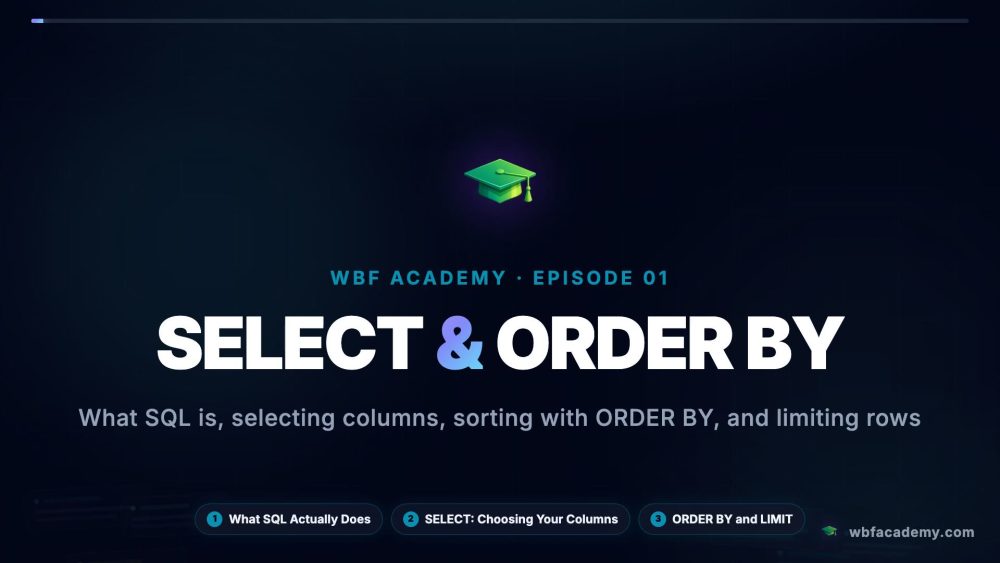
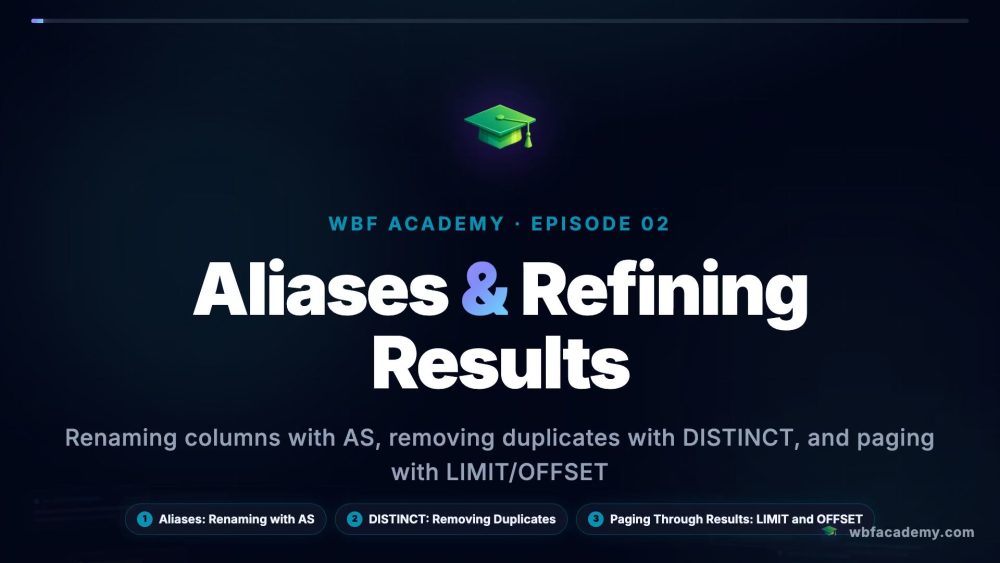
SQL looks intimidating until you write your first query — then it just makes sense. This track starts at zero: what a database and a table actually are, and how SQL lets you ask them questions in plain, structured commands. You will write your first SELECT statement, pull specific columns instead of everything, and use aliases to make results readable. You will learn LIMIT to preview large tables safely and ORDER BY to sort results by any column, ascending or descending. Along the way you will pick up good habits — formatting queries clearly and reading error messages instead of fearing them. By the end you will comfortably explore any table and pull exactly the columns and rows you need.

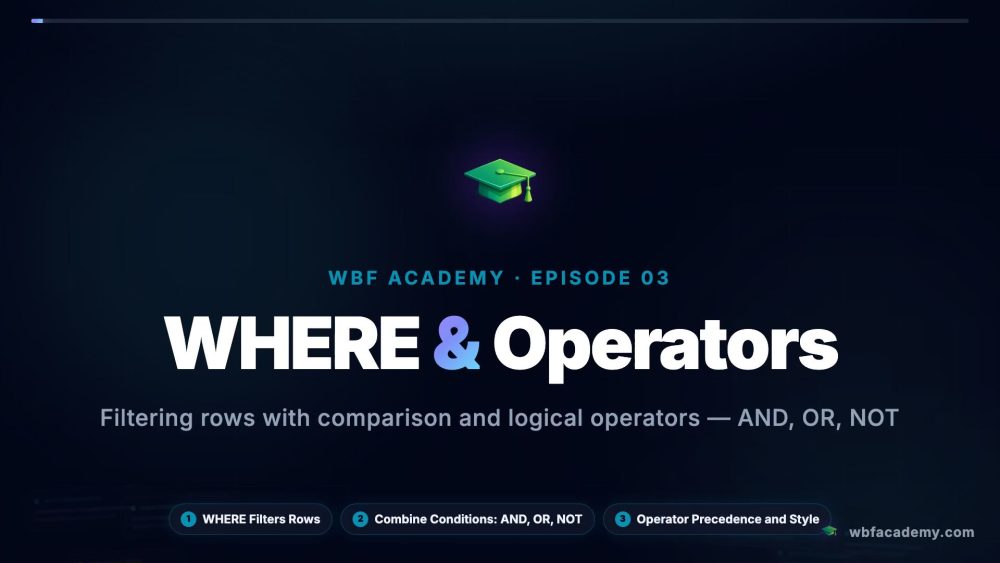
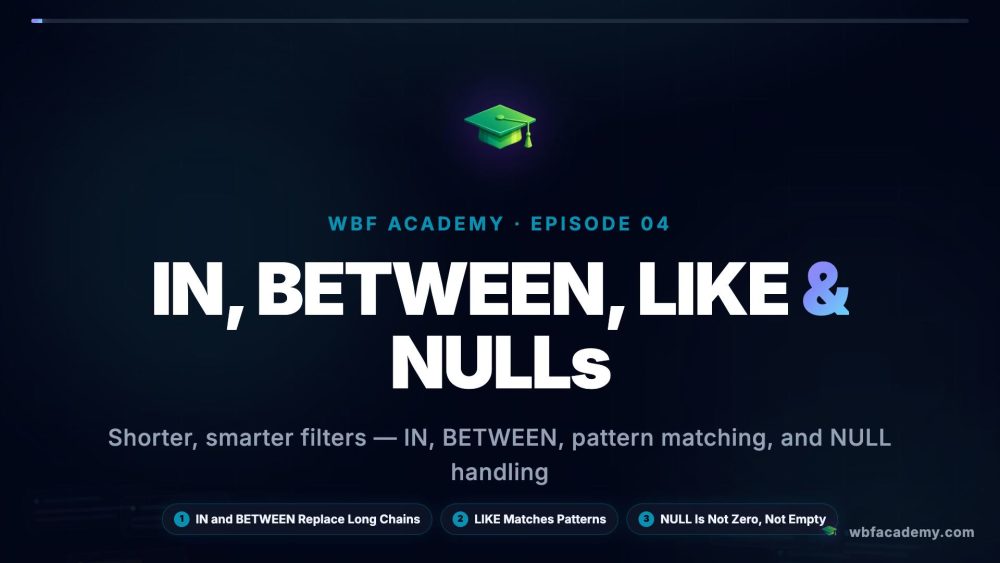
A table with a million rows is useless until you can narrow it down to the ones you actually care about — that is what this track teaches. You will master the WHERE clause and the comparison and logical operators (AND, OR, NOT) that combine conditions precisely. You will learn IN to match a list of values, BETWEEN for ranges, and LIKE for pattern matching text, so you can filter by date ranges, categories, or partial names. You will also handle NULLs correctly, a common source of bugs for beginners, and use DISTINCT to remove duplicate results. By the end you will confidently slice any table down to exactly the rows a real business question calls for, no matter how large the dataset.

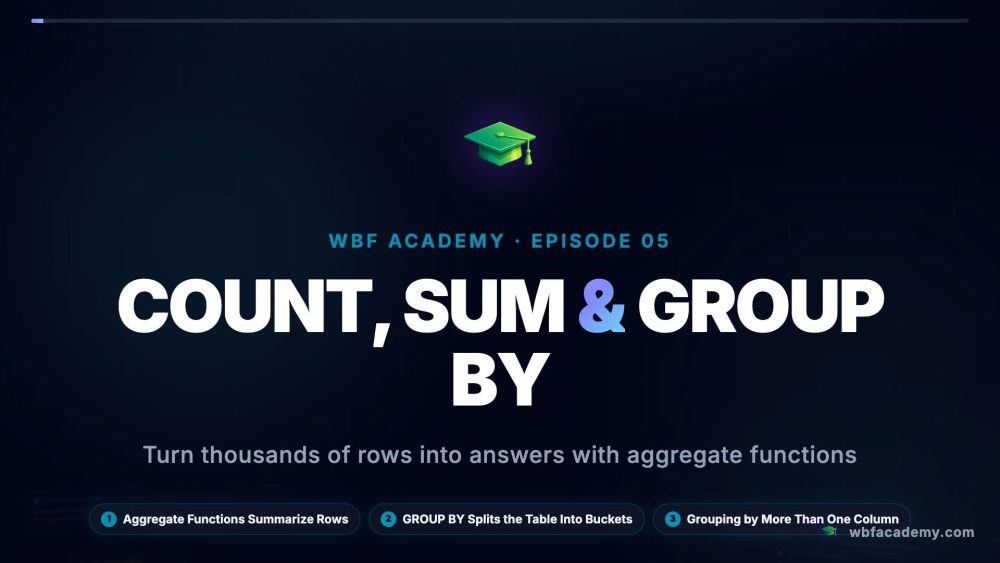
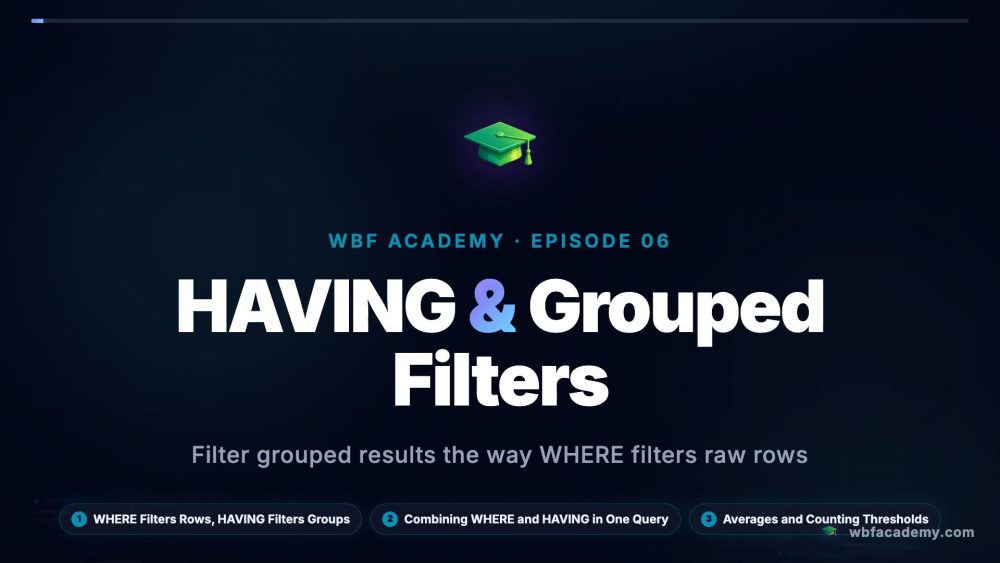
Individual rows tell you what happened once; aggregation tells you what happens overall — and that is where real analysis begins. This track teaches the aggregate functions every analyst uses daily: COUNT to tally rows, SUM to total values, and AVG, MIN, and MAX to summarize a column. You will learn GROUP BY to break totals down by category — sales per region, orders per customer, signups per month — and HAVING to filter those grouped results, the way WHERE cannot. You will practice combining multiple aggregates in one query and reading exactly which rows each group represents. By the end you will turn any raw table into the summary numbers that show up in real reports and dashboards, answering totals, averages, and counts with confidence.

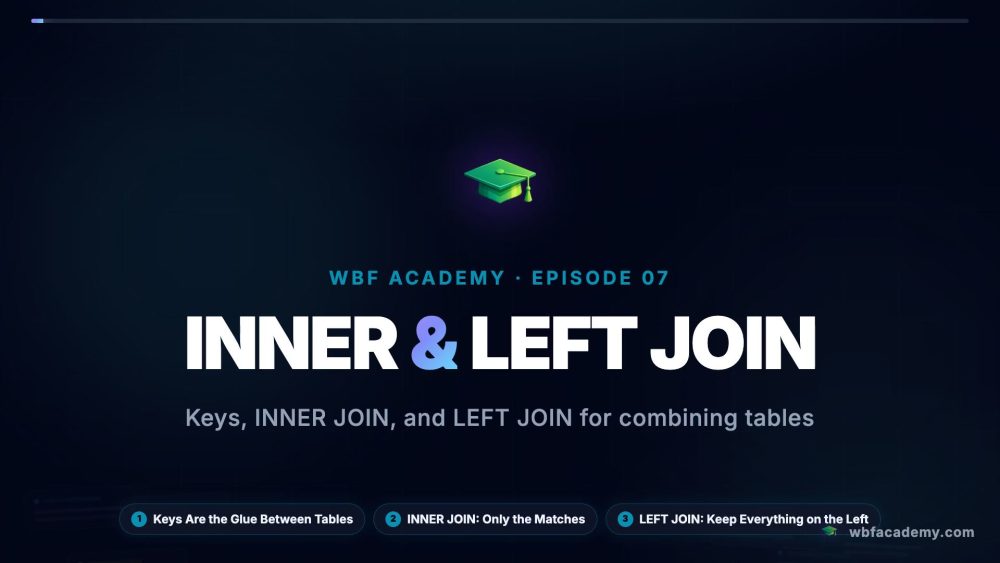
Real data never lives in one table — customers, orders, and products are always split apart, connected by keys. This track teaches you to reconnect them. You will learn what primary and foreign keys are and how they link tables together, then write INNER JOINs to combine matching rows across tables and LEFT JOINs to keep every row from one table even when there is no match — essential for finding customers with no orders or products never sold. You will practice joining three or more tables in a single query, and use self-joins to compare rows within the same table, such as employees and their managers. By the end you will confidently query across an entire database schema instead of being limited to whatever fits in one table.

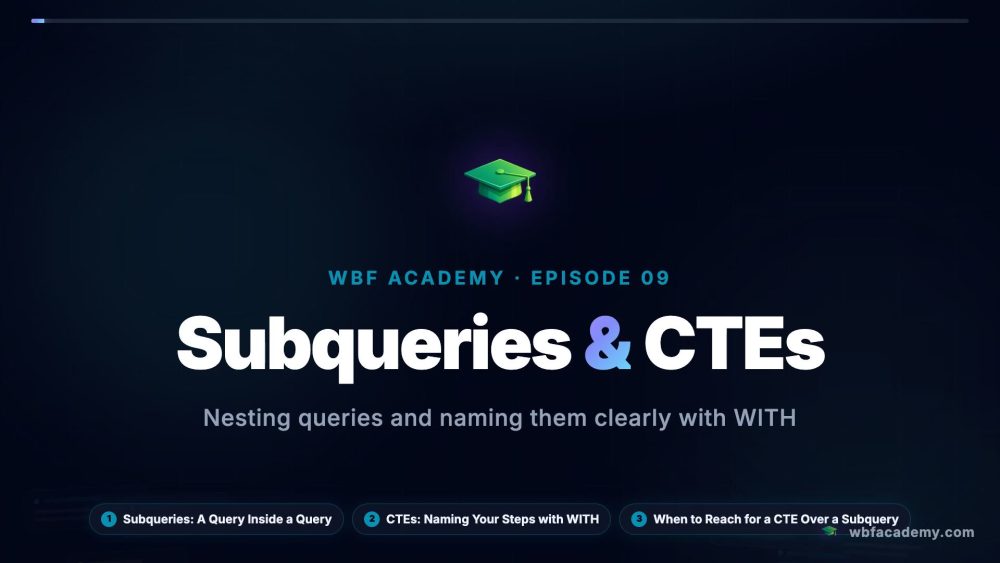
This final track takes you from writing simple queries to writing the advanced SQL that powers real analytics dashboards. You will learn subqueries — queries nested inside other queries — to answer multi-step questions, and common table expressions (CTEs) to break complex logic into clean, readable steps. Then you will move into window functions, the tool behind rankings, running totals, and month-over-month comparisons, learning ROW_NUMBER, RANK, and SUM OVER to calculate results across rows without collapsing them like GROUP BY does. You will practice building a leaderboard, a running revenue total, and a rolling average, the exact patterns used in business intelligence tools. By the end you will write the same level of SQL that professional data analysts rely on every day.

Certification Exam

🏆

Certification Exam

SQL for Data Analytics

30
Questions
45m
Time Limit
% 70%
To Pass

All tracks · No time pressure to start

🏆

Certification Exam

SQL for Data Analytics

#

30 Questions

All difficulty levels

45 Minutes

Auto-submits when time expires

%

70% to Pass

Earn your certification badge

No Going Back

Once you answer, you move forward

Tips

See all